
Hard to compete with that 90s confidence 😎
Hard to compete with that 90s confidence 😎
„It‘s totally a lot smarter than I am, no way could I deliver (234 * 534)^21 as confidently!“
I want those fuckers powering little submarines that fight cancer cells right now - but realistically speaking, these microcontrollers would need to be at least one order two order of magnitude smaller for that, no?

I see your opinion, I’m curious to hear how you think about the media’s role in society. Journalists work at newspapers and they need to pay rent. A stance “paywalls are paid for by the rich and the stupid” kinda means that one doesn’t want to pay journalists.
I am genuinely curious about your perspective on this. Would you prefer a world without newspapers? Or is it more of a question of money? When I was younger, I didn’t have the money to pay for newspapers. Nowadays, I’m happy to pay for newspapers that interest me.
Genius.
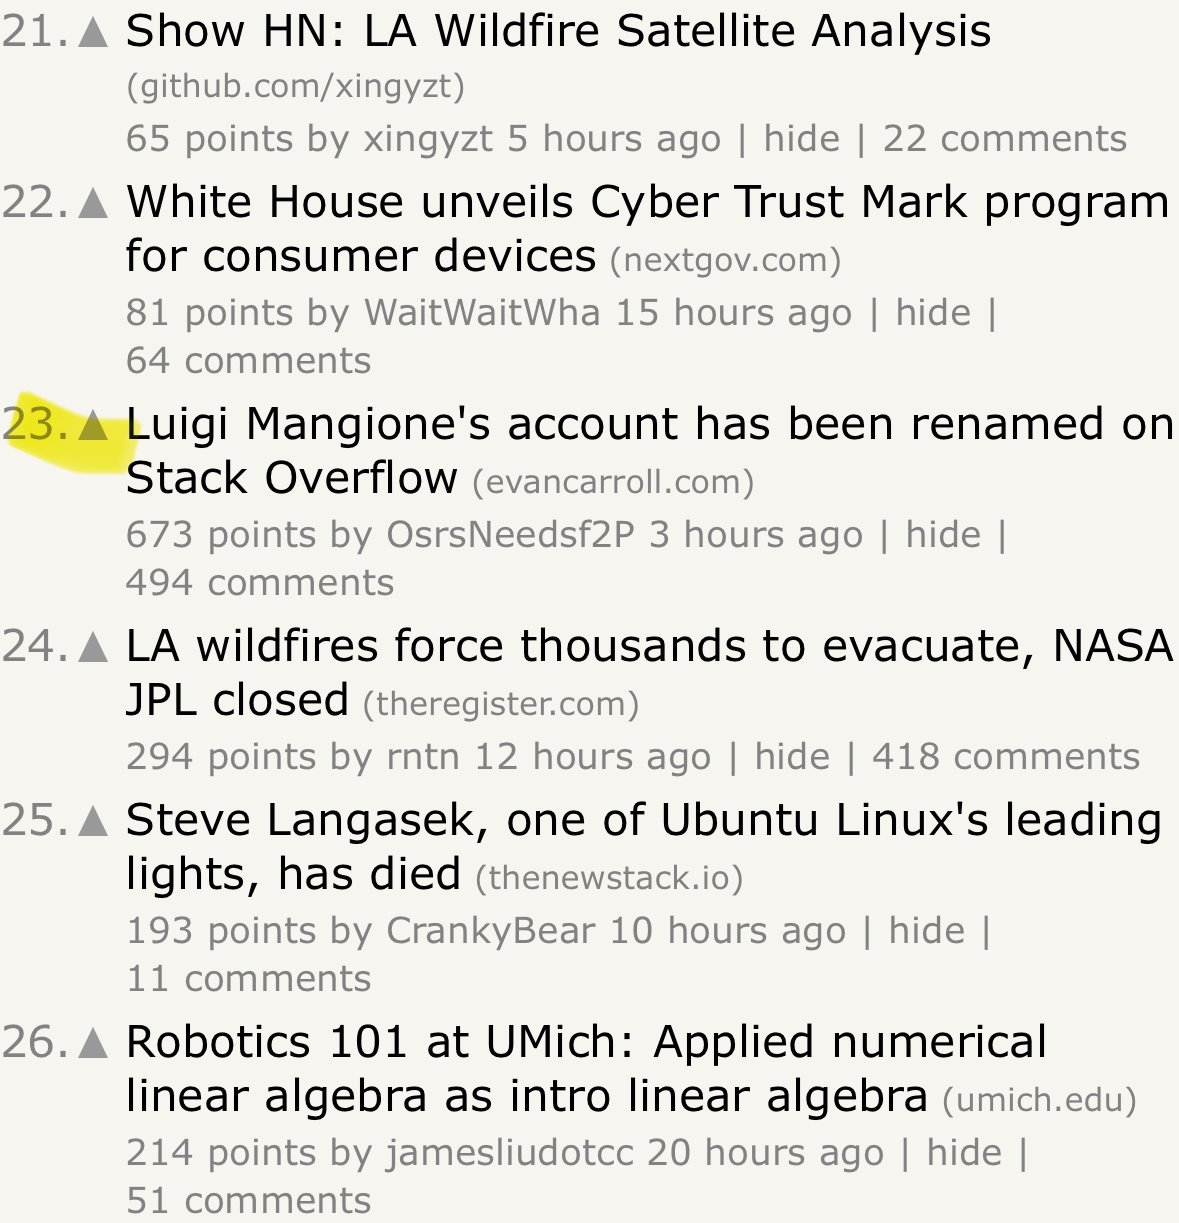
The submission has been clearly penalized by hn moderators: Posted 3h ago, upvoted >600 times with almost 500 comments, ranking 23rd on the front page. Ranking first currently is a submission with 80 upvotes, posted 1h ago.
Thanks for running the thread, appreciate it 🙏
Uff that’s grim.
Highly misleading headline and article. The headline claims that all of GCP went down for 12h. The article claims that „an office in Frankfurt“ was unavailable. Both is wrong.
In reality, some services in the europe-west3-c zone experienced a 12h outage source.
That‘s cool and I respect that, more power to you!
I see you, hang in there buddy!
Yo this comment section is a dumpster fire 🔥
At the all-hands meeting, Garman said he’s been speaking with employees and “nine out of 10 people are actually quite excited by this change.”
Just imagine the conversation between the CEO of AWS and some random employee.
„What do you think about the return-to-office policy I propose, Cog #18574?“ „Great idea Mr. Garman sir, really smart move from your team. Incredible thinking and leadership from you Mr. Garman.“
continues to tell people that 9/10 employees he talks to are excited to return to office.
Carnegie chose to do good things with his money, as did Gates and Boros. Now, it’s easy to criticize all three of them for an arbitrary number of bad things they are responsible for. Which is entirely beside the point:
There is obviously a scale of good and bad things oligarchs decide to do with their money. Musk, Thiel, Sachs and the likes are on the “huge asshole” end of that scale. And other oligarchs are not. Assuming Gates was as bad as Musk because somereason fails to see this and ultimately leads to letting the true assholes off the hook.
They’re clearly not all on the same team. Some are decent human being that choose to use their money for the betterment of humankind.
It’s just that a couple, e.g. Musk, Thiel, David Sachs and others, decided to be huge assholes. They would end democracy any day to become richer and more powerful.
Also, no novelty - strong reject, no revision possible 🙂↔️
While I agree with most points you make, I cannot see a machine that is, at a bare minimum, able to translate between arbitrary languages become irrelevant anytime in the foreseeable future.
I dislike the entire article. Of course google search still works just fine. Claiming otherwise is only possible by magnifying a small, admittedly disfunctioning part of google search.

Probably the oligarchs, based in this law, can use their lawyers to sue the person who dares to do so publicly.

I am a bit too dumb to understand that graph and asked ai for an explanation. It helped me, maybe it also helps others:
This graph comes from a study by Gilens and Page that examines how different groups influence U.S. policy decisions. It has three separate charts, each showing how policy adoption (whether a policy is enacted) relates to the preferences of different groups:
1. Average Citizens’ Preferences (top chart)
2. Economic Elites’ Preferences (middle chart)
3. Interest Group Alignments (bottom chart)
Breaking It Down:
• X-axis:
• In the first two graphs, it represents how much each group supports a policy (from 0% to 100%).
• In the third graph (Interest Groups), the x-axis shows alignment, with negative values meaning opposition and positive values meaning support.
• Y-axis:
• The left y-axis (dark line) shows the predicted probability of a policy being adopted.
• The right y-axis (gray bars) shows how often different levels of support occur in the data (percentage of cases).
Key Takeaways & Surprises:
1. The top chart (Average Citizens) is nearly a flat line.
• This means that whether the general public strongly supports or opposes a policy has little impact on whether it gets adopted.
2. The middle chart (Economic Elites) has a rising curve.
• This suggests that policies supported by the wealthy have a much higher chance of being adopted.
3. The bottom chart (Interest Groups) also shows a strong upward trend.
• The more interest groups align in favor of a policy, the more likely it is to be adopted.
Big Picture:
This graph suggests that the opinions of average citizens have little to no effect on policy decisions, while economic elites and interest groups have significant influence. This challenges the idea that the U.S. operates as a true democracy where the will of the majority decides policy.